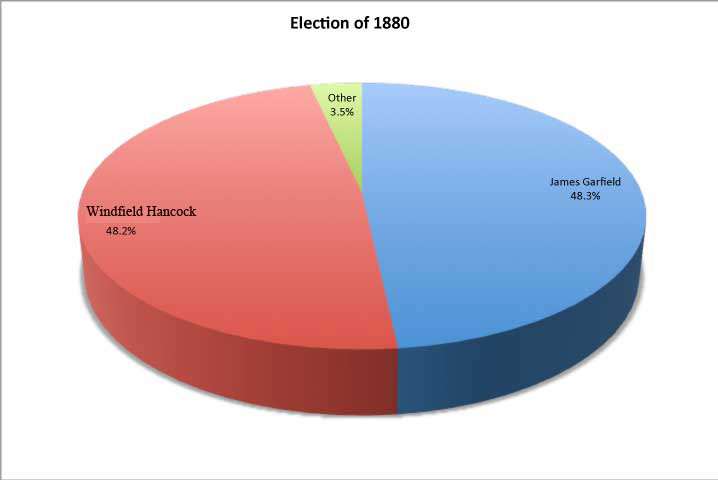
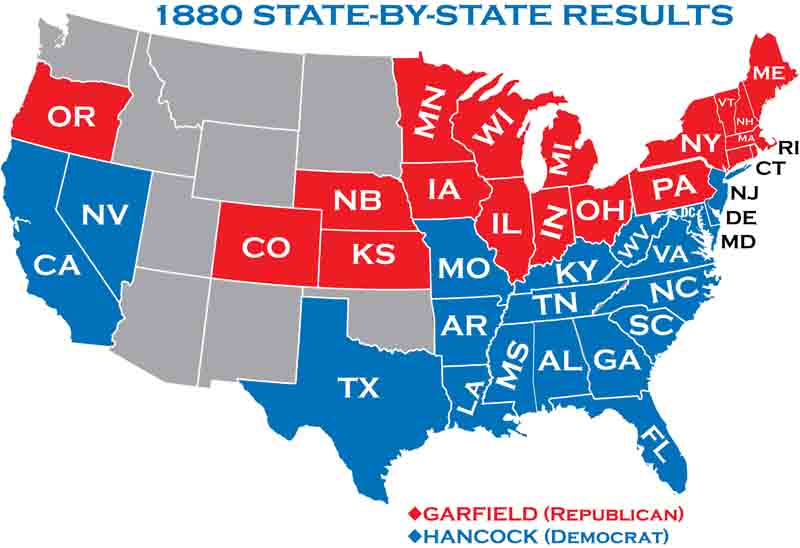
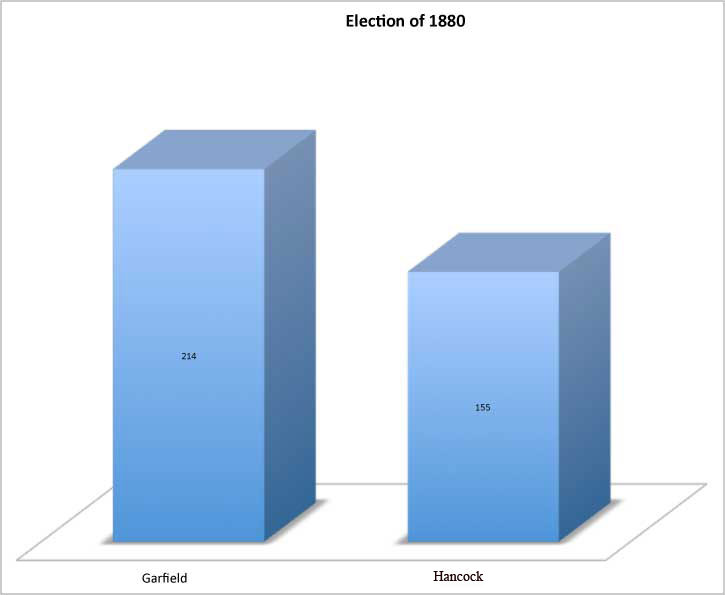
1880 Election Results Garfied vs Hancock

Rutherford Hayes had promised not to run for re-election. Hayes kept his promise. In Chicago, at the Republican convention of 1880, the leading contender for the presidential nomination was former President Grant. Grant wished to run for an unprecedented third term. Anti-Grant forces supported James Blaine of Maine and John Sherman of Ohio. James Garfield gave a significant speech in favor of Sherman. Much of the convention body was impressed by the speech. The convention remained deadlocked through 34 ballots. Suddenly, Wisconsin voted its 16 votes for James Garfield. Garfield, once again, declared his support for Sherman. Garfield’s efforts did not stop the convention for voting for him. On the 36th ballot, Garfield was nominated. Overall, the 1880 election campaign was rather uninspiring. Very few issues divided the candidates. The only issue of substance was the issue of tariffs. The Democratic candidate, Winfield Hancock, supported one for revenue it would produce.
Participation of Eligible Voters:71.3%
Democratic Convention

State results in 1880

Electoral Results in 1880
| Garfield | Hancock | Weaver | Total Votes | ||||
| Votes | Pct | Votes | Pct | Vote | Pct | ||
| Alabama | 56,350 | 37.1 | 91,130 | 60 | 4,422 | 2.9 | 151,902 |
| Arkansas | 42,436 | 39 | 60,775 | 55.9 | 4,116 | 3.8 | 10,870 |
| California | 80,282 | 48.9 | 80,426 | 49 | 3,381 | 2.1 | 164,218 |
| Colorado | 27,450 | 51.3 | 24,647 | 46 | 1,435 | 2.7 | 53,546 |
| Connecticut | 67,071 | 50.5 | 64,411 | 48.5 | 868 | 0.7 | 132,798 |
| Delaware | 14,148 | 48 | 15,181 | 51.5 | 129 | 0.4 | 29,458 |
| Florida | 23,654 | 45.8 | 27,964 | 54.2 | 0 | 51,618 | |
| Georgia | 54,470 | 34.6 | 102,981 | 65.4 | 0 | 157,451 | |
| Illinios | 318,036 | 51.1 | 277,321 | 44.6 | 26,358 | 4.2 | 622,305 |
| Indiana | 232,169 | 49.3 | 225,523 | 47.9 | 13,066 | 2.8 | 470,758 |
| Iowa | 183,904 | 56.9 | 105,845 | 32.8 | 32,327 | 10 | 323,140 |
| Kansas | 121,520 | 60.4 | 59,789 | 29.7 | 19,710 | 9.8 | 201,054 |
| Kentucky | 106,059 | 39.7 | 149,068 | 55.9 | 11,499 | 4.3 | 266,884 |
| Louisiana | 38,978 | 37.3 | 65,047 | 62.3 | 437 | 0.4 | 104,462 |
| Maine | 74,052 | 51.5 | 65,211 | 45.3 | 4,409 | 3.1 | 143,903 |
| Maryland | 78,515 | 45.4 | 93,706 | 54.1 | 828 | 0.5 | 173,049 |
| Massachusetts | 165,198 | 58.5 | 111,960 | 39.6 | 4,548 | 1.6 | 282,505 |
| Michigan | 185,335 | 52.5 | 131,596 | 37.3 | 38,895 | 9.9 | 353,076 |
| Minnesota | 93,939 | 62.3 | 53,314 | 35.4 | 3,267 | 2.2 | 150,806 |
| Mississippi | 34,844 | 29.8 | 75,750 | 64.7 | 5,797 | 5 | 117,068 |
| Missouri | 154,647 | 38.7 | 208,600 | 52.5 | 35,042 | 8.8 | 397,289 |
| Nebraska | 54,979 | 62.9 | 28,523 | 32.7 | 3,853 | 4.4 | 87,355 |
| Nevada | 8,732 | 47.6 | 9,611 | 52.4 | 0 | 18,343 | |
| New Hampshire | 44,856 | 51.9 | 40,797 | 47.2 | 528 | 0.6 | 86,361 |
| New Jersey | 120,555 | 49 | 122,565 | 49.8 | 2,617 | 1.1 | 245,928 |
| New York | 555,544 | 50.3 | 534,511 | 48.4 | 12,373 | 1.1 | 1,103,945 |
| North Carolina | 115,616 | 48 | 124,204 | 51.5 | 1,126 | 0.5 | 240,946 |
| Ohio | 375,048 | 51.7 | 340,867 | 47 | 6,456 | 0.9 | 724,984 |
| Oregon | 20,619 | 50.5 | 19,955 | 48.9 | 267 | 0.7 | 40,841 |
| Pennsylvania | 444,704 | 50.8 | 407,428 | 46.6 | 20,667 | 2.4 | 874,783 |
| Rhode Island | 18,195 | 62.2 | 10,779 | 36.9 | 236 | 0.8 | 29,235 |
| South Carolina | 57,954 | 34.1 | 111,236 | 65.5 | 567 | 0.3 | 169,793 |
| Tennessee | 107,677 | 44.3 | 129,569 | 53.3 | 6,017 | 2.5 | 243,263 |
| Texas | 57,225 | 23.8 | 155,963 | 64.8 | 27,471 | 11.4 | 240,659 |
| Vermont | 45,567 | 70 | 18,316 | 28.1 | 1,215 | 1.9 | 65,098 |
| Virginia | 83,634 | 39.3 | 128,647 | 60.5 | 0 | 212,660 | |
| West Virginia | 46,243 | 41.1 | 57,390 | 50.9 | 9,008 | 8 | 112,641 |
| Wisconsin | 144,406 | 54 | 114,650 | 42.9 | 7,986 | 3 | 267,202 |
 >
>